Software tailored to HVAC sector
APPLICATION
- Dimensioning of storage tanks in large buildings such as hotels, sports halls, ...
- Well insulated house with low heating demand and high domestic hot water comfort requirements.
ACCURATE
The calculation is done on a minute-by-minute basis. This is important because when hot water is consumed the temperature in the storage tank is constantly changing. To determine the comfort level correctly, the calculation must be repeated every minute.

Worst case scenario day
The calculation checks whether the comfort level is maintained for a worst case scenario day (= day with a lot of hot water consumption).
Users determine the worst-case scenario themselves using the following settings:
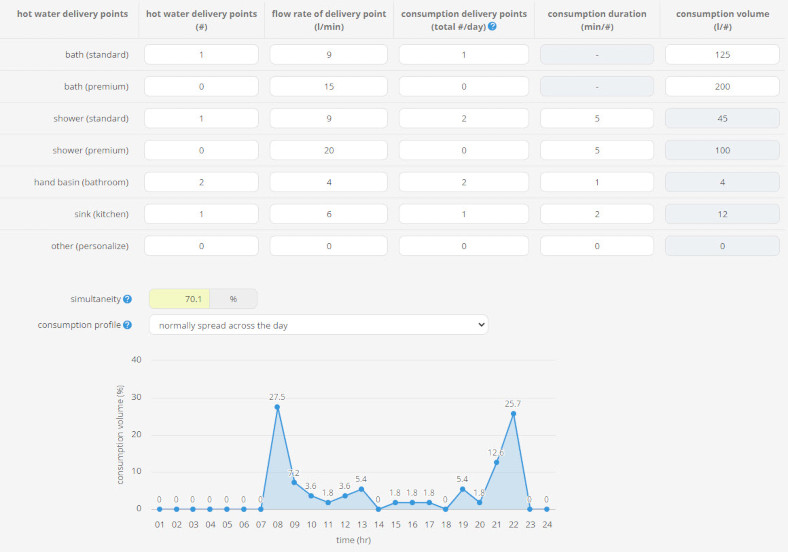
- number of showers, baths, ... taken per day
- times of the day when the peaks occur
- water temperature that must come out of the shower as a minimum (e.g. 40°C)

Result
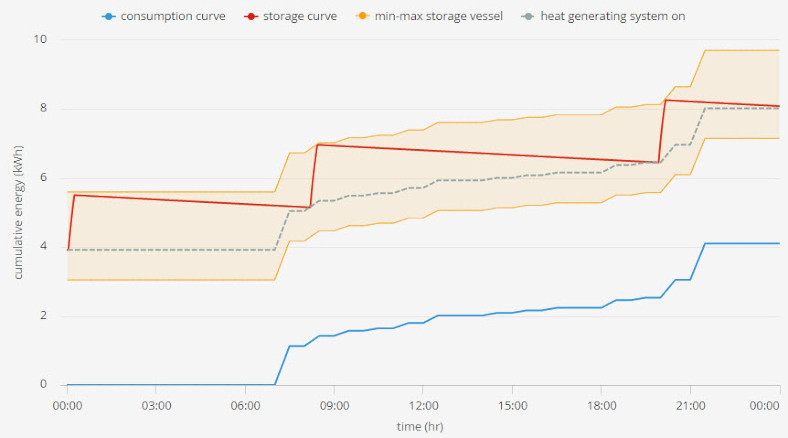
The result is a graph with the hours of the day on the X axis and the energy available in the storage tank on the Y axis.
The blue line is the consumption curve and here we see a first peak in consumption in the morning around 7 am.
If the red line rises, the storage tank is heated and if the red line falls, it cools down.
Instructional video
Details on sizing domestic hot water storage tanks can be found in this instructional video.


